WEEKLY COVID-19 TRENDS | Coronavirus surging into election week
COLUMBUS — Heading into election week, the coronavirus pandemic in Ohio isn't just getting worse — it's getting worse at an alarming rate.
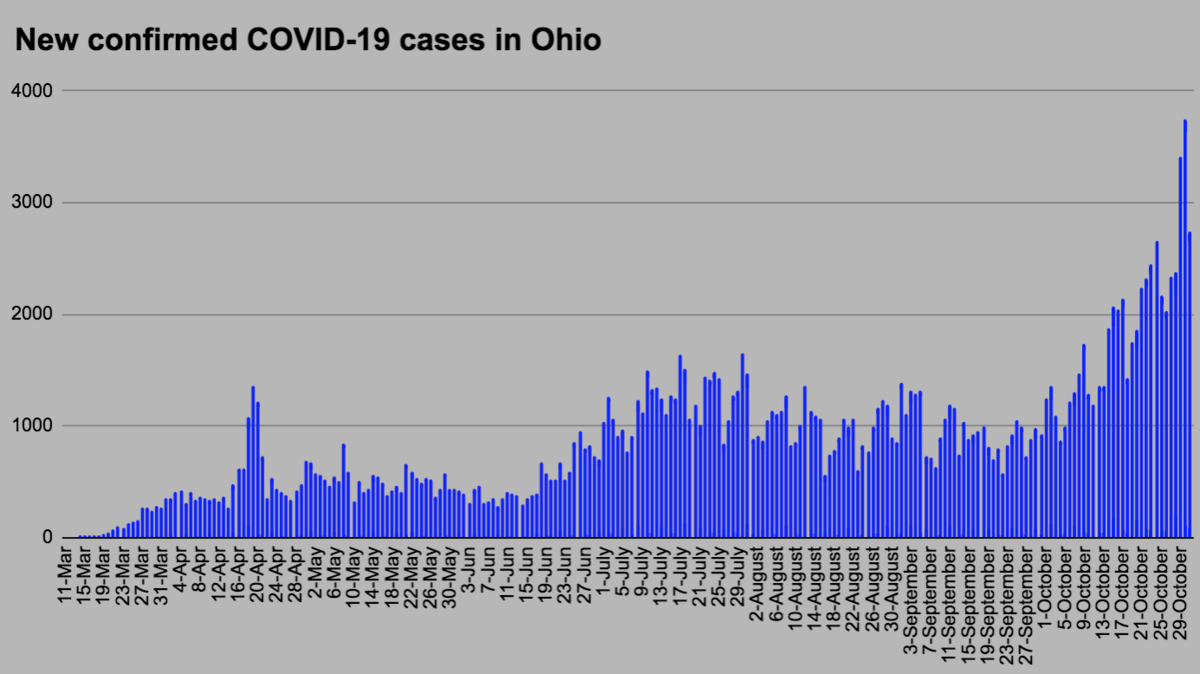
Unlike the state's previous spikes, this one is steep, and there are no signs of letting up.
Between Oct. 25 and Oct. 31, Ohio reported 18,828 new confirmed cases of COVID-19. It's the third week in a row the state has set a new weekly record.
- Oct. 11 to Oct. 17: 12,047 cases
- Oct. 18 to Oct. 24: 14, 717 cases
- Oct. 25 to Oct. 31: 18,828 cases
On Oct. 30, the state set a sobering new record: 3,745 new confirmed COVID-19 cases in a single day.
If you dismiss the surge as a result of increased testing, you should take a closer look.
The state also set a new record for most hospitalizations in a single week; 1,126 Ohioans were hospitalized last week for COVID-19.
Meanwhile, the state's average test positivity rate has more than doubled since mid-September. On Sept. 24, the seven-day positivity average hit a low of 2.7 percent. On Friday, the average was 6.7 percent.
Oct. 25 to Oct. 31 in numbers
- Of Ohio’s 206,549 total reported confirmed cases as of Nov. 1, 31,300 are presumed to be active infections.
- There have been 1,126 new hospitalizations; a total of 19,220 people have been hospitalized to date.
- Between Oct. 25 and Oct. 31, 92 Ohioans have died due to COVID-19. The state has reported 4,990 confirmed deaths to date.
- Ohio is reporting 11,140 people have recovered from the virus between Oct. 25 and Oct. 31. The state has reported 170,259 total recovered cases.
Ohio Public Health Advisory System map
During his Thursday briefing, DeWine released an updated map for the state's Public Health Advisory System. There are now 43 counties in Level 3 "red" — the most since the map was released. Just two counties are "yellow."
As of Thursday, 83 of Ohio's 88 counties are considered to have a high incidence of virus transmission; these are counties that have seen more than 100 cases per 100,000 residents in the past two weeks.
"The virus is raging throughout the state of Ohio. There's no place to hide," DeWine said during his Thursday address. He also again urged Ohioans to rethink holiday plans.
While DeWine continues to beg Ohioans to don face coverings, he has begun to emphasize the role of personal responsibility in combatting the virus.
DeWine on Thursday said the state is relying on Ohioans' sense of personal responsibility to slow the spread of coronavirus, rather than "mask police."
"Ohioans have been able to dramatically increase mask-wearing. We saw this back in July when we had a statewide mask order," resulting in 85 percent to 90 percent compliance in some areas, he said.
"When we saw that, we saw cases go down. We can do this again," DeWine said. "We don't have the ability to have 'mask police' everywhere. We rely on the goodwill of the people of the state of Ohio.
DeWine is also calling on local governments to "redouble" their efforts in combatting the virus.
In terms of stemming the spread locally, Mercy Health Chief Clinical Officer Dr. Jim Kravec said, for the most part, schools and businesses are already doing a great job. The issue lies in the public's perception of the pandemic, he said.
"Where I see opportunity is, really, a small percentage of the population that is not following the distancing and the masking," Kravec said. "Some people don't 'buy' what we're telling them. It's hard to get through to people that don't believe the message."
Surge in the Valley
Mahoning County remains at "red" on the alert map and is also considered to have high incidence of coronavirus spread. The county reported 318 new cases in the last two weeks, 139.06 new cases per capita.
The county now meets four of the state's seven risk indicators for coronavirus spread: new cases per capita; increasing numbers of new cases; the number of new cases occurring outside group settings such as long-term care or correctional facilities; and increasing outpatient visits for COVID-like illnesses.
Between late August and mid-September, Mahoning County saw the lowest-ever numbers of new cases and hospitalizations per day, according to Mahoning County Public Health's COVID-19 dashboard. Though new cases have skyrocketed — the county marked its highest single-day total, 67 new cases, on Oct. 15 — daily hospitalizations have remained in the single digits.
"I think we have capacity now. We actively monitor this every day and, really, the numbers on the Mahoning County dashboard are really the best indicators," Kravec said. "As a level-1 trauma center, we are prepared for increased numbers.
"But we need to make sure we reduce the hospitalizations so we continue to keep room for the people who are sick."
ICU bed occupancy in Mahoning County has hovered between about 65 percent and 75 percent for weeks, according to ODH. That includes non-COVID patients. But the portion of COVID-19 patients in the ICU rose steadily from 5.5 percent on Oct. 14 to 12.6 percent on Oct. 26.
Mahoning County on Tuesday reported 78.5 percent ICU occupancy, nearly meeting the state's 80 percent risk threshold under the Ohio Public Health Advisory System map.
Trumbull County was upgraded to "red" on Thursday and is considered a high incidence county. In the past two weeks, Trumbull County reported 232 new cases, 117.19 new cases per capita.
It meets four risk indicators: new cases per capita; increasing numbers of new cases; the number of new cases occurring outside group settings such as long-term care or correctional facilities; and increasing outpatient visits for COVID-like illnesses.
Columbiana County remained at "orange," but is also considered a high incidence county. In the past two weeks, Columbiana County reported 119 new cases, 116.80 cases per capita.
It meets three risk indicators: new cases per capita; the number of new cases occurring outside group settings such as long-term care or correctional facilities; and increasing outpatient visits for COVID-like illnesses.
Testing
- The recent volume of virus testing statewide continued steady gains over the week. So far this month, agencies statewide administered an average of 9,171 more tests per day than in September.
- The average percent of positive tests continues an upward trend that began Sept. 24, when positivity was at an all-time low.
The seven-day moving average for positive tests was 6.7 percent on Friday, the highest since July 14 and more than double the average 2.7 percent reported on Sept. 24, which was the lowest since the pandemic began. That average percent peaked on April 20 at 23.6 percent.
Coronavirus week by week
Here's a breakdown of how each complete week of the pandemic has looked like in Ohio so far. Data in bold reflect the peaks in new cases, deaths, hospitalizations and ICU admissions.
March 15 to March 21
- New cases: 221
- New deaths: 3
March 22 to March 28
- New cases: 1,159
- New deaths: 22
- New hospitalizations: 261
- New ICU admissions: 123
March 29 to April 4
- New cases: 2,333
- New deaths: 77
- New hospitalizations: 662
- New ICU admissions: 203
April 5 to April 11
- New cases: 2,448
- New deaths: 140
- New hospitalizations: 853
- New ICU admissions: 246
April 12 to April 18
- New cases: 3,752
- New deaths: 192
- New hospitalizations: 660
- New ICU admissions: 188
April 19 to April 25
- New cases: 5,044
- New deaths: 237
- New hospitalizations: 596
- New ICU admissions: 178
April 26 to May 2
- New cases: 3,554
- New deaths: 279
- New hospitalizations: 581
- New ICU admissions: 128
May 3 to May 9
- New cases: 4,023
- New deaths: 264
- New hospitalizations: 604
- New ICU admissions: 134
May 10 to May 16
- New cases: 3,276
- New deaths: 243
- New hospitalizations: 570
- New ICU admissions: 100
May 17 to May 23
- New cases: 3,452
- New deaths: 299
- New hospitalizations: 567
- New ICU admissions: 129
May 24 to May 30
- New cases: 3,351
- New deaths: 182
- New hospitalizations: 574
- New ICU admissions: 119
May 31 to June 6
- New cases: 2,769
- New deaths: 210
- New hospitalizations: 449
- New ICU admissions: 102
June 7 to June 13
- New cases: 2,485
- New deaths: 176
- New hospitalizations: 404
- New ICU admissions: 104
June 14 to June 20
- New cases: 3,169
- New deaths: 136
- New hospitalizations: 337
- New ICU admissions: 79
June 21 to June 27
- New cases: 4,907
- New deaths: 101
- New hospitalizations: 423
- New ICU admissions: 83
June 28 to July 4
- New cases: 6,519
- New deaths: 96
- New hospitalizations: 487
- New ICU admissions: 136
July 5 to July 11
- New cases: 7,840
- New deaths: 123
- New hospitalizations: 659
- New ICU admissions: 116
July 12 to July 18
- New cases: 9,356
- New deaths: 95
- New hospitalizations: 743
- New ICU admissions: 143
July 19 to July 25
- New cases: 9,050
- New deaths: 164
- New hospitalizations: 632
- New ICU admissions: 126
July 26 to Aug. 1
- New cases: 8,484
- New deaths: 207
- New hospitalizations: 785
- New ICU admissions: 138
Aug. 2 to Aug. 8
- New cases: 7,453
- New deaths: 150
- New hospitalizations: 569
- New ICU admissions: 97
Aug. 9 to Aug. 15
- New cases: 7,345
- New deaths: 150
- New hospitalizations: 784
- New ICU admissions: 113
Aug. 16 to Aug. 22
- New cases: 6,117
- New deaths: 148
- New hospitalizations: 568
- New ICU admissions: 109
Aug. 23 to Aug. 29
- New cases: 6,778
- New deaths: 150
- New hospitalizations: 539
- New ICU admissions: 78
Aug. 30 to Sept. 5
- New cases: 8,168
- New deaths: 127
- New hospitalizations: 520
- New ICU admissions: 80
Sept. 6 to Sept. 12
- New cases: 6,374
- New deaths: 149
- New hospitalizations: 476
- New ICU admissions: 56
Sept. 13 to Sept. 19
- New cases: 6,347
- New deaths: 198
- New hospitalizations: 466
- New ICU admissions: 87
Sept. 20 to Sept. 26
- New cases: 5,871
- New deaths: 123
- New hospitalizations: 435
- New ICU admissions: 72
Sept. 27 to Oct. 3
- New cases: 7,221
- New deaths: 178
- New hospitalizations: 550
- New ICU admissions: 72
Oct. 4 to Oct. 10
- New cases: 8,872
- New deaths: 72
- New hospitalizations: 620
- New ICU admissions: 106
Oct. 11 to Oct. 17
- New cases: 12,047
- New deaths: 70
- New hospitalizations: 654
- New ICU admissions: 114
Oct. 18 to Oct. 24
- New cases: 14,717
- New deaths: 137
- New hospitalizations: 997
- New ICU admissions: 166
Oct. 25 to Oct. 31
- New cases: 18,828
- New deaths: 92
- New hospitalizations: 1,126
- New ICU admissions: 154
This story was originally published November 2, 2020 at 3:52 AM with the headline "WEEKLY COVID-19 TRENDS | Coronavirus surging into election week."